A monthly electronic newsletter summarizing Minnesota's climate conditions and the resulting impact on water resources. Distributed on the first Thursday of the month.
State Climatology Office - DNR Division of Ecological and Water Resources, St. Paul
Distributed: March 21, 2025 (apologies for the late report)
What happened in February 2025:
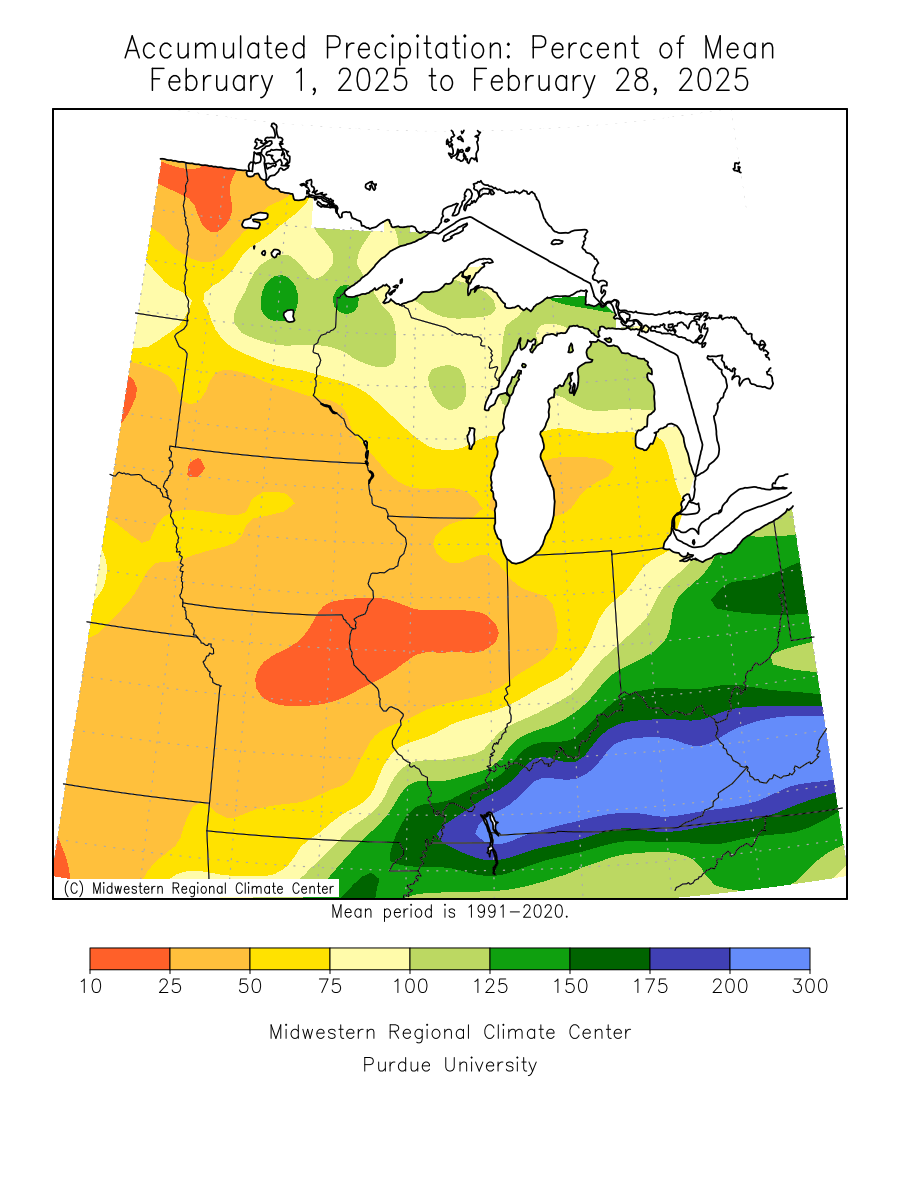
- February is on average the driest month of the year. Normal precipitation is generally less than an inch for most locations. Precipitation for February 2025, was generally below normal across the state, with a few exceptions. One of the higher monthly precipitation totals found was at Wolf Ridge In Lake County with 2.05 inches, or .88 inches above normal. One of the driest locations was .12 (twelve hundredths) at Benson in Swift County. The preliminary state average for Minnesota was .50 inches or .33 inches below normal.
[see: February 2025 Precipitation Total Map | February 2025 Precipitation Departure Map | February 2025 Climate Summary Table | February 2025 Percent of Normal Precipitation Map] - There were a couple of snow events that stood out in the month.
- February got off to a wintry start in parts of Minnesota, as a disturbance produced gusty winds and several inches of snow in the northeast, with lighter accumulations elsewhere. Accumulations of two inches or more covered the northeastern 40% of Minnesota, and near Lake Superior and in parts of the Arrowhead region accumulations of 5-7 inches were common. The Wolf Ridge Environmental Learning Center observer for the National Weather Service measured 7.2 inches of snow, and numerous observers with the CoCoRaHS network measured 6-7 inches. The Cloquet Forestry Center measured 6.3 inches and the Duluth airport measured 6.2 inches officially. Other snowfall totals included 6.0 inches at Floodwood, Ely, and Celina; 5.4 inches at Brimson and Tower; 5.3 inches at International Falls; 5.0 inches at Indus and Embarrass; 4.3 inches at Two Harbors, and 3.3 inches at Brainerd.
[see: Northeast Minnesota Snow, February 1-2, 2025] - The next event was on Saturday, February 8, when a narrow band of 6 to 12+ inches of snow fell along an east-west line through central Wisconsin. Areas to the north and south of this band saw lesser amounts with Rochester and La Crosse seeing 1-2 inches of snow. [see: Heavy Snow of February 8, 2025 ]
- February 2025 was a cold month on average and would have wound up much colder had there not been a warm surge of air for the last week of the month. There was a wide range in temperatures. For instance in the Twin Cities the lowest temperature in February 2025 was -15 degrees on the 18th and the warmest temperature was 55 degrees on the 26th, a seventy degree swing. The preliminary average statewide temperature was 11.8 degrees or 3.7 degrees below normal. The coldest temperature found in February 2025 was -38 degrees on February 13 at Embarrass and the warmest temperature found so far was 59 degrees on February 24th at Winnebago in Faribault County.
[see: Minnesota Climate Trends | February 2025 Climate Summary Table | 2025 February Departure from Normal Temperature Map]
Where we stand now:
- The snow depth ranking for March 20 shows the snowpack in full retreat over the northeast, with bare ground over all but the areas in southeast Minnesota hit by the March 19, Winter Storm .
[see: Weekly Snow Depth and Ranking Maps | NWS Snow Depth Estimation Map | Midwest Regional Climate Center Snow Depth Map] - The U. S. Drought Monitor map released on March 20, 2025 shows that the multi-year drought continues. Only 6% of Minnesota has no drought designation. About 27% of the state was Abnormally Dry, 59% of the state is in Moderate Drought conditions, and 8% of the state is under Severe Drought conditions. The U.S. Drought Monitor index is a blend of science and subjectivity where drought categories (Moderate, Severe, etc.) are based on several indicators.
[see: Drought Conditions Overview] - The U.S. Geological Survey reports that stream discharge values (where winter measurements are possible) show a wide range of streamflow values mostly in the near normal to below normal streamflow values in the south, to normal to above normal in the central, and a wide range from much below normal, to much above normal in the north. .
[see: USGS Stream Flow Conditions] - In their final report of the 2024 growing season (November 29), the Agricultural Statistics Service reported that topsoil moisture across Minnesota was 12 percent Very Short, 33 percent Short, 51 percent Adequate, and 4 percent Surplus. History has shown that soil moisture conditions observed in the late autumn are indicative of conditions to be expected when the soil thaws. Soil moisture levels at Lamberton on November 15 showed soil moisture recovery since mid-October, but still a little short of historical averages. Soil temperatures at the U of M St. Paul Campus Climate Observatory were in the mid-20s to around 30 degrees at the four inch depth under sod in February.
[see: Agricultural Statistics Service Crop Progress and Condition | U. of M. Southwest Research & Outreach Center (Lamberton) | U. of M. Southern Research & Outreach Center (Waseca)] - The potential for wildfires is currently rated by DNR Forestry as Low across the entire state.
[see: Fire Danger Rating Map] - Frost depths were fairly deep this winter and the thaw is progressing fairly close to historical averages. The top few inches to a foot is thawed in the central and south with still a lens of frost from 20 inches to 40 inches deep. .
[see: National Weather Service Frost Depth Data | MnDOT Road Frost Depths | Minnesota Department of Agriculture Six-Inch Soil Temperature Network ] - Lake ice out 2025 is beginning in earnest across the southern part of the state, with lake ice out progressing so far from one to two weeks ahead of the median. The median date for lake ice to leave lakes in far southern Minnesota is late March. Lake and river ice is never completely safe. Ice cover on Lake Superior has generally been below the 1973-2024 median for the winter. On March 20, 2025 6% of Lake Superior was ice covered. The maximum ice coverage for Lake Superior typically happens in late February. For the 2024-25 lake ice season, the maximum lake ice coverage for Superior was 45% on February 21st .
[see: DNR Conservation Officer Reports | 2025 Lake Ice-Out Dates | Great Lakes Ice Cover]
Future prospects:
- This report is late enough to where the 30 day outlook is for April! The 30 day outlook for precipitation has equal chances over all but the southeast part of the state where there is a slight tilt for above normal precipitation. Normal April precipitation ranges 1.5 inches in northwest Minnesota to around three inches in southeast counties. The historical probability of measurable precipitation for any given day in April ranges from 20 percent in the far northwest to 35 percent in the southeast..
[see: Climate Prediction Center 30-day Outlook | March Precipitation Normal Map] - Hard to say if there will be a continued pattern of the general warm pattern seen in March. The April temperature outlook indicates equal chances of below normal, normal and above normal temperatures. Normal April high temperatures are in the mid to upper 40s early in the month, rising to the low 60s by month's end. Early-April normal low temperatures are near 20 in the north, near 30 in the south. By month's end, low temperatures average in the mid-30s in the north, near 40 in the south.
[see: Climate Prediction Center 30-day Outlook | March Temperature Normal Map] - The 90-day precipitation outlook for March through May indicates equal chances for below, normal and above normal precipitation and temperatures across the state..
[see: Climate Prediction Center 90-day Outlook] - The National Weather Service produces long-range probabilistic river stage and discharge outlooks for the Red River, Minnesota River, and Mississippi River basins. These products address both high flow and low flow probabilities. Here are the current weather conditions impacting prospects for spring snow melt flooding:
- There is a very low flood risk this spring, mostly due to the fact that due to the lack of snowfall, there was not much water in the snowpack that existed. Much of the state is covered by some level of drought and in most places, precipitation would be welcome to replenish the soil moisture deficit.
[see: National Weather Service –Covering Mississippi and Minnesota Rivers]
[see: National Weather Service – Covering Red River and Devils Lake Basin]
[see: National Weather Service - North Central River Forecast Center]
From the author:
- The Meteorological Winter (December-February) of 2024-25 finished very near normal for temperature, with a fairly mild December, a near normal January and a fairly cool February. It was fairly dry winter overall with the preliminary statewide average precipitation of 1.63 inches or 1.14 inches below normal. below normal.
Upcoming dates of note:
- March 21: National Weather Service releases 30/90 day temperature and precipitation outlooks
![]() Subscribe to email announcements of the monthly posting of this product.
Subscribe to email announcements of the monthly posting of this product.
Pete Boulay, DNR Climatologist