A monthly electronic newsletter summarizing Minnesota's climate conditions and the resulting impact on water resources. Distributed on the first Thursday of the month.State Climatology Office - DNR Division of Ecological and Water Resources, St. Paul
distributed: February 13, 2025
 Subscribe to email announcements of the monthly posting of this product.
distributed: February 13, 2025
What happened in January 2025:
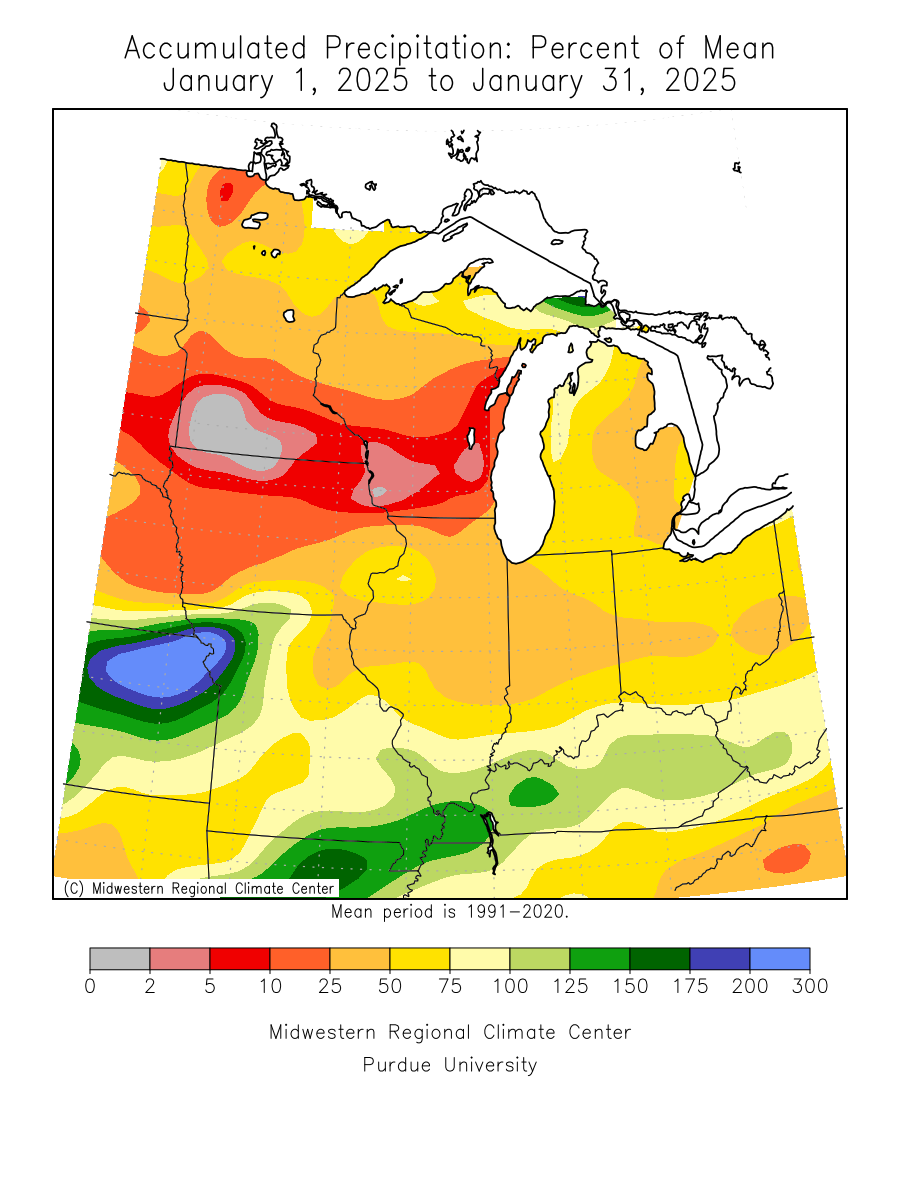
- It was a relatively quiet and dry January precipitation-wise, with the bulk of the snowfall favoring the far north. All sites fell short of normal. The preliminary statewide average was .22 inches or .62 inches below normal. This is the second January in a row with below normal precipitation, with the preliminary total for January 2025 being tied for the 9th driest January on record. The site with the most precipitation found so far was Wolf Ridge with .89 inches, one of the drier locations was the Rochester International Airport with only .02 (two hundredths) of an inch of precipitation or .97 inches short of normal.
[see: January 2025 Precipitation Map | January 2025 Precipitation Departure Map | January 2025 Climate Summary Table | January 2025 Percent of Normal Precipitation Map] - There was one precipitation event of note for January 2025. A Clipper-like system moved east to west across Minnesota on January 11 and continuing into January 12, 2025. Many places from the Twin Cities on north saw at least 1-3 inches of snow with a wide area of 2-4 inch totals over the central and north. Southern Minnesota largely missed out though. The highest snowfall totals were from Park Rapids to Duluth where six to eight inches of snow fell. One of the higher snowfall totals was at the Duluth National Weather Service with 7.2 inches.
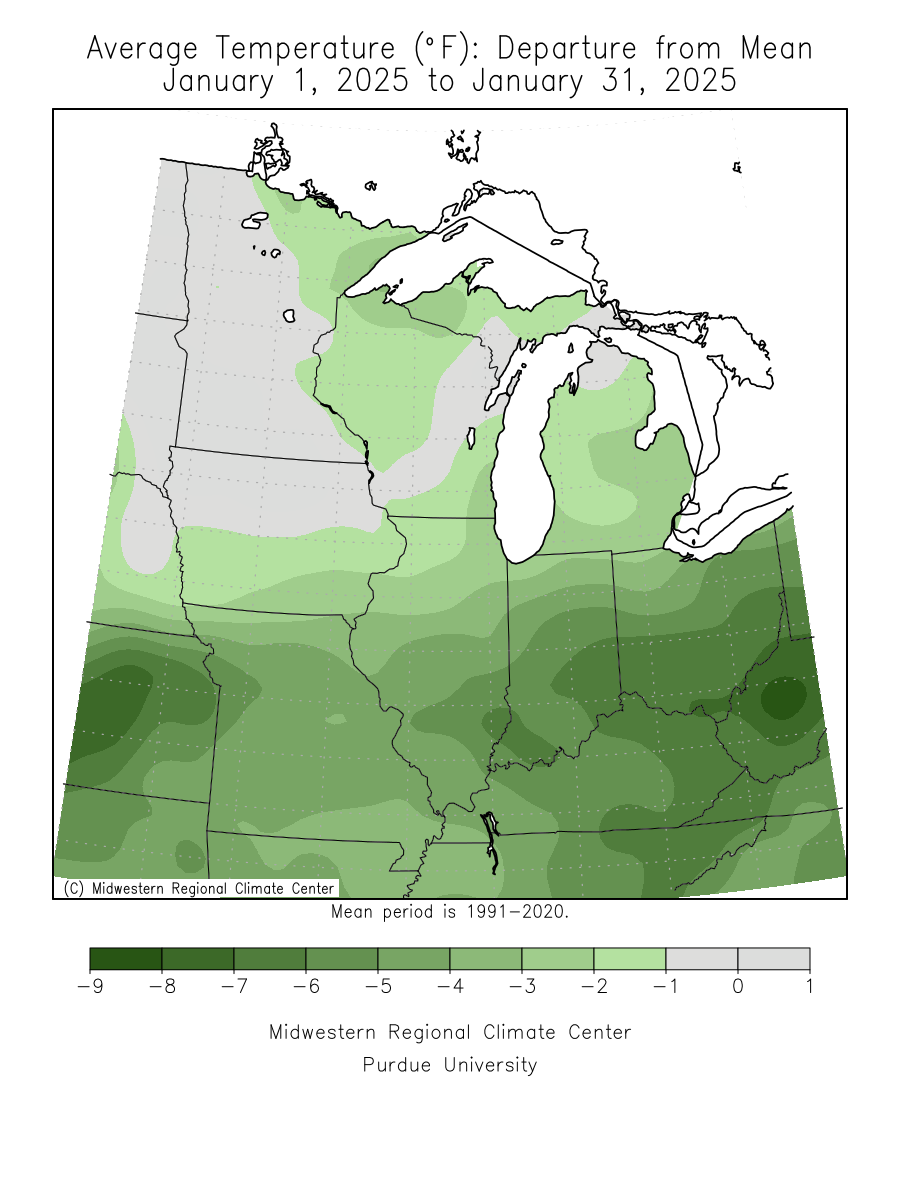
[see: Snowfall of January 11-12, 2025] - January 2025 was about ten degrees colder than January 2024 with a preliminary statewide average temperature of 11.1 degrees or 0.1 degree (one tenth of a degree) below normal. Multiple sites across southern Minnesota saw a maximum temperature of 58 degrees on the 30th and the coldest temperature found so far was -42 degrees at Kabetogama on January 20.
[see: January 2025 Climate Summary Table | January 2025 Departure from Normal Temperature Map
Where we stand now:
- On February 13, snow depth was generally lacking over the southern part of the state, but over the north the snow cover has been gradually increasing with small events and temperatures cool enough to prevent melting. There is eight inches or more north of a line from Pine City to Fergus Falls, with lesser totals in the Red River Valley and higher totals in the northeast.
[see: Weekly Snow Depth and Ranking Maps | NWS Snow Depth Estimation Map | Midwest Regional Climate Center Snow Depth Map] - The U. S. Drought Monitor map released on February 13, 2025 depicts 94% of the state with some level of drought designation. About 31% of the state was Abnormally Dry, and 55% of the state in Moderate Drought conditions. 7% of the state are in Severe Drought conditions. The U.S. Drought Monitor index is a blend of science and subjectivity where drought categories (Moderate, Severe, etc.) are based on several indicators.
[see: Drought Conditions Overview] - The U.S. Geological Survey reports that stream discharge values in Minnesota (where winter measurements are possible) are normal, to below historical medians. Most rivers and streams are impacted by ice.
[see: USGS Stream Flow Conditions] - In their final report for the season, On November 29, 2024 the Agricultural Statistics Service reported that topsoil moisture across Minnesota was 12 percent Very Short, 33 percent Short, 51 percent Adequate, and 4 percent Surplus. Harvest was finishing up by the end of November. Soil moisture levels at Lamberton on November 15 showed soil moisture recovery since mid-October, but still a little short of historical averages.
[see: Agricultural Statistics Service Crop Progress and Condition | U. of M. Southwest Research & Outreach Center (Lamberton) | U. of M. Southern Research & Outreach Center (Waseca)] - The potential for wildfires is currently rated by DNR Forestry as Low across Minnesota.
[see: Fire Danger Rating Map] - Frost is fairly deep this season and the deepest frost since 2019. Frost depths for early February range from one to two feet deep in the south, and two to three feet deep in the central and north. Sandy Lake Dam in Aitkin County and White Rock Dam in Traverse County have frost depths of 40 inches.
[see: National Weather Service Frost Depth Data | MnDOT Road Frost Depths | University of Minnesota - St. Paul Campus Soil Temperatures Under Sod] - The lake ice season got to a good start in late November, then the warm December caused some poor lake ice conditions. The arrival of colder winter temperatures for the first couple weeks in January helped to improve the ice, but very mild temperatures at the end of the month, soaring to the low 50's put a pause on lake ice formation. Cold air returned in February. Lake Superior ice cover is fairly low, but starting to build this season with 17% covered by ice.
[see: DNR Conservation Officer Reports | 2024 Lake Ice-In Dates | Great Lakes Ice Cover]
Future prospects:
- The February precipitation outlook has a tilt for above normal precipitation over the the eastern 2/3rds of the state, with equal chances over the western part of the state. Precipitation normals range from near one-half inch of liquid equivalent in western Minnesota to just over three-quarter of an inch of precipitation in eastern sections of the state. The median snow depth at the end of February ranges from under five inches in southwest Minnesota to over 18 inches on the ground in northeastern Minnesota (greater than 30 inches in the Lake Superior highlands).
[see: Climate Prediction Center 30-day Outlook | February Precipitation Normal Map] - The February temperature outlook has a slight tendency for below normal temperatures over the central and north, with equal chances of above normal and below normal temperatures in the south. Normal February high temperatures range from the low teens in the north to near 20 in the south early in the month, climbing to the mid-20s to low 30s by month's end. Normal February low temperatures range from near minus 10 degrees in the far north to the single digits above zero in southern Minnesota early in the month; ascending to the low single digits in the north, mid-teens in the south by the end of February.
[see: Climate Prediction Center 30-day Outlook | February Temperature Normal Map] - The 90-day precipitation outlook for February through April indicates equal chances of above, normal and below normal precipitation over the western 2/3rds of Minnesota with a slight tendency for above normal precipitation over the eastern US. .
[see: Climate Prediction Center 90-day Outlook] - The National Weather Service produces long-range probabilistic river stage and discharge outlooks for the Red River, Minnesota River, and Mississippi River basins. These products address both high flow and low flow probabilities. Here are the current weather conditions impacting prospects for spring snow melt flooding:
- Red River: For the Red River, the risk for significant (moderate or higher) spring flooding is low with this outlook issuance, running below long-term historical averages across the Red River Basin (US portion). Minor to isolated moderate spring flooding in this outlook (50% exceedance probability) for some locations. Well above normal precipitation last November led to saturated soils and slightly elevated river levels before freeze-up. However, snowfall and associated precipitation has been below normal this winter for the majority of the basin. Minimal snowpack early in the winter followed by below normal temperatures has led to a deep frost layer. Below normal temperatures are expected to continue into spring and may lead to a delayed snowmelt. Late winter and spring precipitation, along with the timing/thaw cycle of any snowpack will be the most important spring flood risk factors.
- Minnesota and Mississippi: Overall, the initial flood threat is below normal. Despite a bit of recent snowfall, another below-normal snow winter has set us up for a below-normal threat, but this winter has been much colder than last year. The cold winter temperatures recently, coupled with lack of snow cover has led to deep frost penetration. Our low probability worst case outcome would be a back-loaded snowfall winter followed by Spring rainfall before the ground has a chance to thaw, leading to excessive runoff and flooding. Much like last year, we find ourselves at the mercy of short-range weather patterns to cause most of the flooding as opposed to ideal conditions leading up to the season.
- We still have quite a bit of winter to go, so there may be changes to the situation.
State Climatology Office Water Cooler Talk:
- How deep can frost get? With the lack of snow over the first part of the winter, and some cold temperatures, some of the deepest frost depths since 2019 have been measured in the state. Historically, frost depths have been measured under sod for input in the spring flood outlook. Frost depths can go much deeper under pavement that has been cleared of snow. Frost depths have been measured at a site in Maplewood, just north of St. Paul for 25 years. The deepest frost depth so far for the 2024-2025 winter under sod is 25 inches. This is the deepest frost since 2019. The deepest frost measured in 25 years was 35.2 inches during the winter of 2007-2008. The shallowest frost was a mere 4 inches in the winter of 2022-2023 and that was due to a deep insulating snow cover that shielded the ground from the cold air above. The median deepest frost depth in Maplewood is 20 inches.
[see: Frost Depth in Minnesota for Winter 2025]
Upcoming dates of note:
- February 20: National Weather Service releases 30/90 day temperature and precipitation outlooks