A monthly electronic newsletter summarizing Minnesota's climate conditions and the resulting impact on water resources. Distributed on the first Thursday of the month.
State Climatology Office - DNR Division of Ecological and Water Resources, St. Paul
distributed: September 8, 2023
What happened in August 2023:
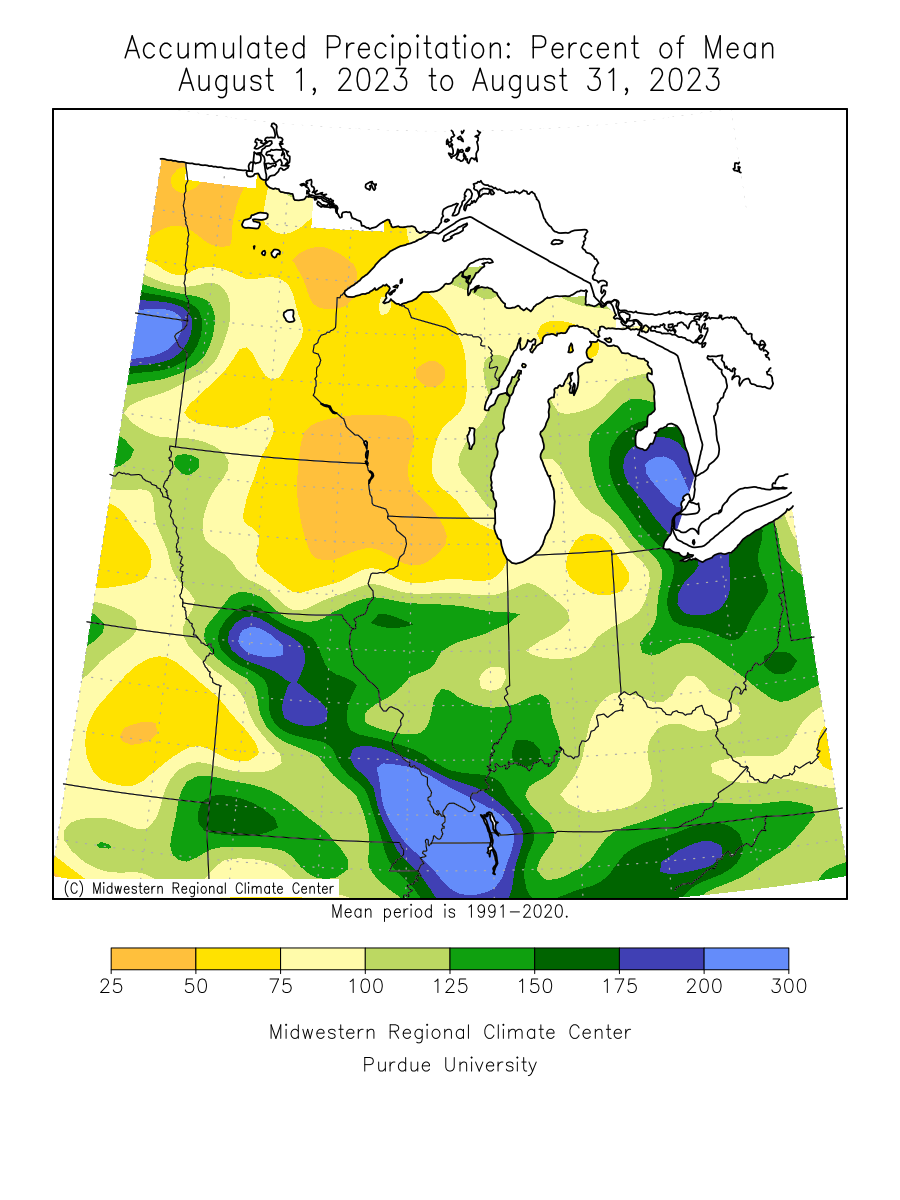
- The parade of dry summer months continued in August 2023. The driest locations were in eastern and especially southeastern Minnesota, but much of the state finished short of normal. A few spots saw above normal precipitation, such as an area in west central Minnesota near the South Dakota border, and a small bulls-eye centered in northwest Wright County. One of the largest rainfall totals for the month was 11.03 inches at a CoCoRaHS site near Kimball in Stearns County, and one of the drier locations was .76 inches at Caledonia, 3.71 inches below normal. The preliminary statewide average precipitation was 2.44 inches or 1.28 inches below normal.
[see: August 2023 Precipitation Total Map | August 2023 Precipitation Departure Map | August 2023 Climate Summary Table | August 2023 Percent of Normal Precipitation Map] - There was one large noteworthy storm event during the month. The most significantly damaging thunderstorms of 2023 (at least through early September) developed over central, eastern, and southern Minnesota on Friday August 11th, producing heavy hail and strong winds, and striking the Twin Cities right as people were leaving work for the weekend. The storms produced extensive damage to vehicles, rooftops, windows, and siding. The extent of damage from these storms may be hard to estimate because so much property is covered by personal insurance policies, but this storm appears to have produced larger hail over a larger population than the intense hail storm of May 19, 2022.
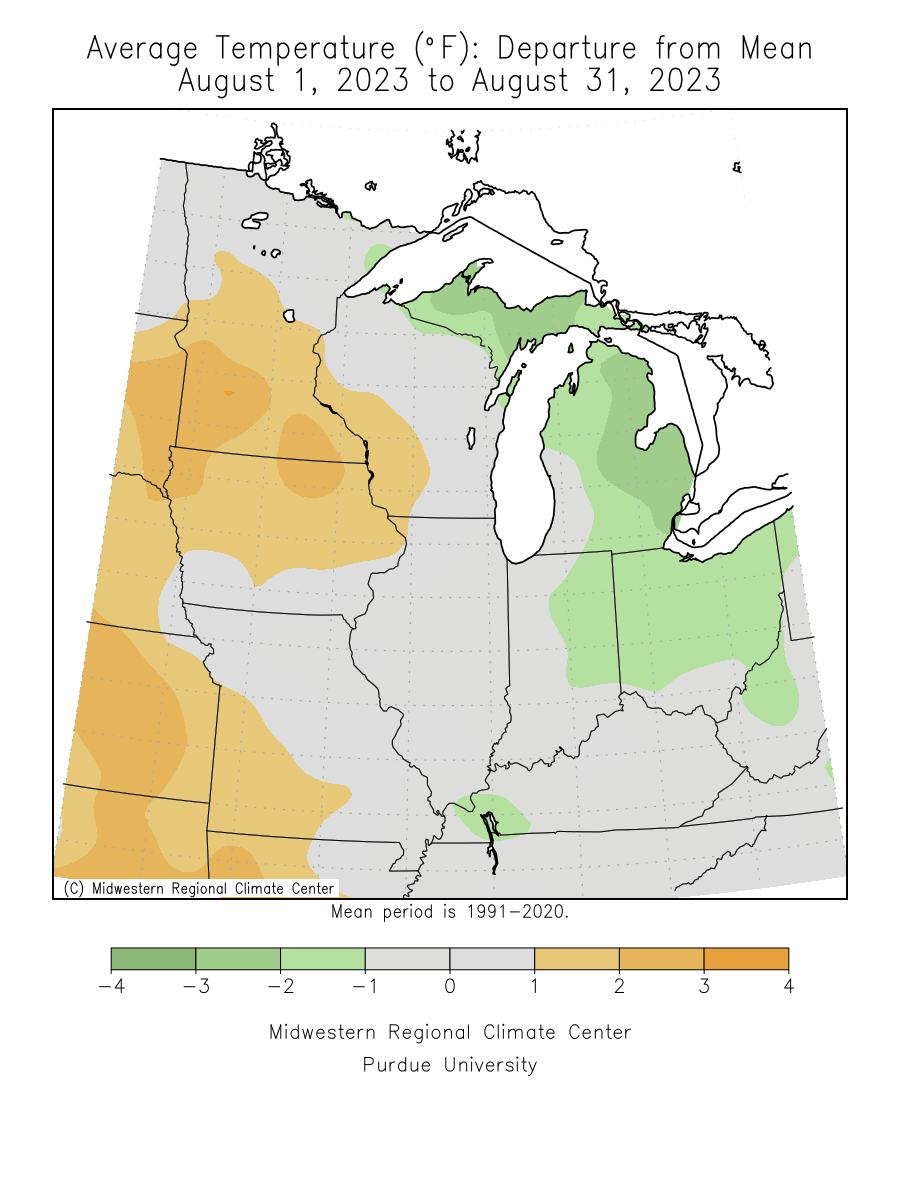
[see: (Happy Hour Hail! August 11, 2023] - For the fourth August in a row, Minnesota finished with above normal temperatures. The preliminary average was 69.1 degrees or 1.5 degrees above normal. August 21-23 stood out with high heat and high humidity. The peak of the heat wave was August 22, with a high temperature of 103 degrees at Canby in Yellow Medicine County and Heat Index Values in southern Minnesota were in the 110s F. The lowest temperature of the month was at Goodridge on August 10 and Brimson on August 18.
[see: August 21-23 Heat] - [see: August 2023 Climate Summary Table | 2023 August Departure from Normal Temperature Map]
Where we stand now:
- Seasonal precipitation totals (April 1 through September 5) generally ranked below the historical median, except for a small area of southwest and far north central Minnesota. Portions of east central, northeast and southeast Minnesota ranked below the 2 percentile, or one of the driest growing seasons on record.
[see: Seasonal Precipitation Ranking Map] - The U. S. Drought Monitor map released on September 5 depicts 15% of the state in the Abnormally Dry category, 30% in the Moderate Drought category, 39% in the Severe Drought category, 15% in the Extreme Drought category and 1% in the Exceptional Drought category. This is only the second year since 1988 that part of Minnesota was in the Exceptional Drought category. The other year was in 2021. Last year at this time there was 74% of the state that was free of any drought designation. The U.S. Drought Monitor index is a blend of science and subjectivity where drought categories (Moderate, Severe, etc.) are based on several indicators.
[see: Drought Conditions Overview] - The U.S. Geological Survey reports that stream discharge levels to be below normal to much below normal across much of the state, with a few exceptions. The Straight River near Park Rapids and the Sauk River near St. Cloud are low. The Mississippi River at St. Cloud and Brooklyn Park are much below normal. The Red River of the North is generally seeing “normal” stream flow values for this time of year. There is above normal stream flow on the Yellow Medicine River near Granite Falls and much above normal flow at the Bois De Sioux River near White Rock, South Dakota.
[see: Cooperative Stream Gauging | USGS Stream Flow Conditions] - Water levels on Minnesota lakes vary depending on lake and location in the state. Mille Lacs on September 7 was at 10.68 feet. On September 8, Minnetonka was at 927.92 feet, .22 feet lower than this time last year. Gray's Bay Dam closed on July 11. Last year it closed on July 21. On September 7, White Bear Lake was at 922.17 about a foot lower than this time last year and the lowest water level since 2015. The level of Lake of the Woods is below the median band, with Rainy Lake right in the middle of the medina band. Lake Superior was forecasted to be at 602.59 feet on September 1, five inches above the early September average and unchanged since early August, 2023. The lake level in Superior is forecast for a continued slow fall over the next month.
[see: Mille Lacs Lake Water Level | Lake Minnetonka Water Level | White Bear Lake Water Level | Lake of the Woods Control Board Basin Data | Corps of Engineers Great Lakes Water Levels - The Agricultural Statistics Service on September 5 reports that topsoil moisture across Minnesota is 28 percent Very Short, 43 percent Short, 29 percent Adequate, and 0 percent Surplus. Available soil water at Lamberton on August 15 was approximately 3.38 inches, less than early August and below the an improvement since mid-August, but still short of the median by .78 inches.
[see: Agricultural Statistics Service Crop Progress and Condition | U. of M. Southwest Research & Outreach Center (Lamberton)] - The potential for wildfires rated by DNR Forestry on September 9, as Low across north central, northeast and east central Minnesota. Moderate potential exists all of southern, much of central, and part of Northwest Minnesota. Historically, 80 percent of all wildfires in Minnesota occur during April and May. There was a 82 acre fire in Cloquet near Barnum during the first week of September.
[see: Fire Danger Rating Map]
Future prospects:
- The September precipitation outlook has a tendency for below normal precipitation across the state, except the northwest where there are equal chances for below, above September precipitation normal values range from about one-and-a-half inches in northwest Minnesota to about four inches in northeast and southeastern counties.
[see: Climate Prediction Center 30-day Outlook | September Precipitation Normal Map] - The September temperature outlook has a strong tendency for above normal temperatures. In the Twin Cities, nine of the last eleven Septembers from 2012 to 2022 were above normal for average temperature. Normal September high temperatures are in the middle to upper 70's degrees to start the month, dropping to the low to mid 60's by month's end. Normal lows are in the 50's early in the month, falling to the middle 30's to mid-40s by late September.
[see: Climate Prediction Center 30-day Outlook | September Temperature Normal Map] - The 90-day precipitation outlook for September through November indicates an equal chance for above, below and normal precipitation in northern and central Minnesota, with a tilt to below normal precipitation in the south. The September through November temperature projection offers a tendency for above-normal conditions statewide.
[see: Climate Prediction Center 90-day Outlook] - The Winter Outlook (December-February) from the Climate Prediction Center depicts a fairly strong tendency for above normal temperatures across not only Minnesota, but all the states that border Canada (including Alaska). There is a slight tilt for below normal precipitation across the northern part of the state and equal chances for below-normal, near-normal, or above-normal precipitation across the southern 2/3rds of the state statewide. The last three winters had La Niña conditions and the winter of 2023-24 will be under the influence of El Niño.
[see: Climate Prediction Center 3.5 month Outlook] - The National Weather Service produces long-range probabilistic river stage and discharge outlooks for the Red River, Minnesota River, and Mississippi River basins. These products address both high flow and low flow probabilities.
[see: National Weather Service - North Central River Forecast Center]
From the author:
- The 2023 preliminary count of tornadoes is approximately 20 for Minnesota with a fairly quiet year for tornado activity. In 2022 there were 71 for Minnesota, the most since 2010. May 2022 had 47 tornadoes.
Upcoming dates of note:
- September 21: National Weather Service releases 30/90 day temperature and precipitation outlooks
![]() Subscribe to email announcements of the monthly posting of this product.
Subscribe to email announcements of the monthly posting of this product.
Pete Boulay;DNR Climatologist