A monthly electronic newsletter summarizing Minnesota's climate conditions and the resulting impact on water resources. Distributed on the first Thursday of the month.
State Climatology Office - DNR Division of Ecological and Water Resources, St. Paul
distributed: July 8, 2024
What happened in June 2024:
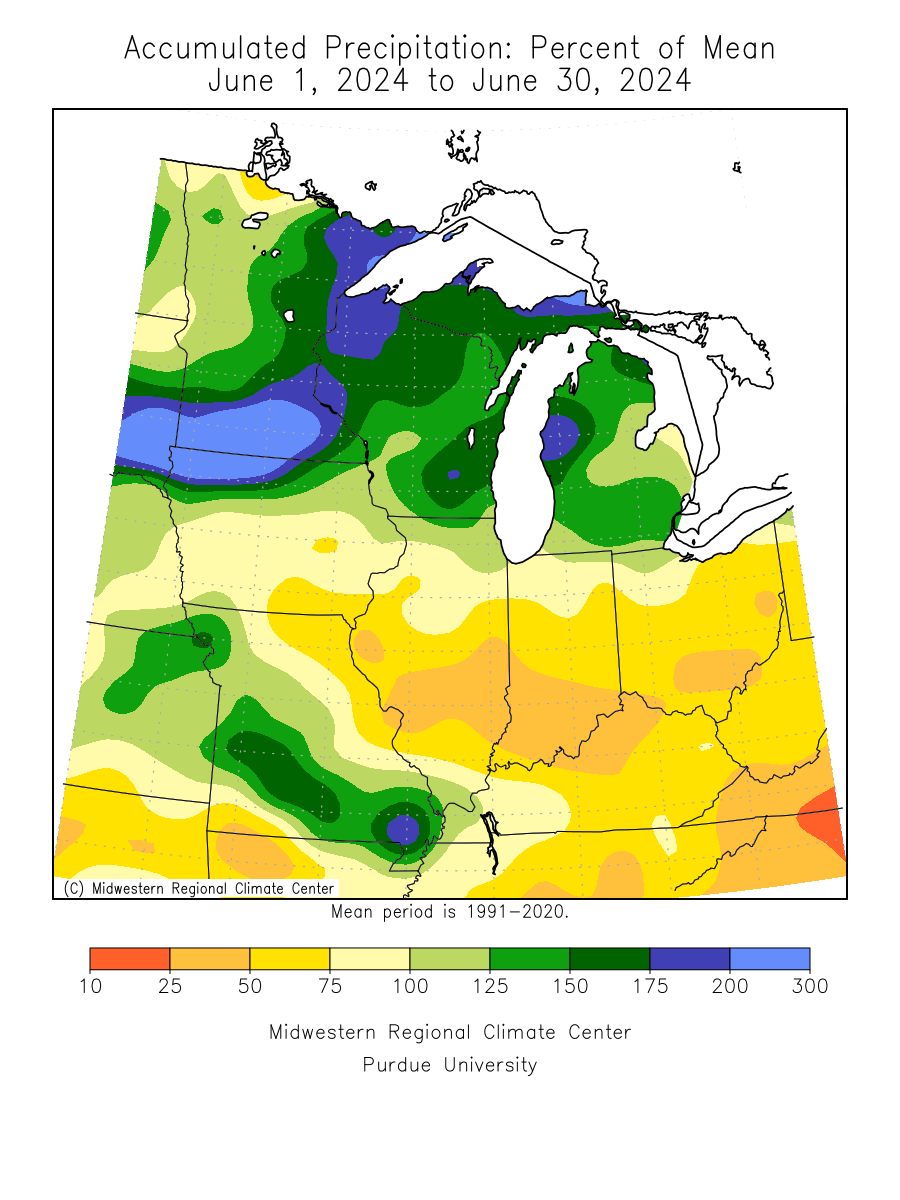
- On average, June is our wettest month in the state. However, some places in southern Minnesota saw three Junes' worth of precipitation. The preliminary statewide average from the gridded monthly map was 7.94 inches, or about 3.5 inches above normal. Some locations set the wettest June on record. Windom wound up with 14.58 inches (old record 11.06 inches 1914) 9.85 above normal. Wells had 15.25 inches (old record 12.58 inches 2013) and 9.95 inches above normal. Owatonna had 13.33 inches (old record 10.83 inches in 1967) or 8.05 inches above normal. Faribault wound up with 17.64 inches (old record 12.96 inches in 2014) and 12.07 inches above normal, and also the highest Minnesota National Weather Service Coop station total (found so far) for June 2024. The all-time record monthly total is 23.86 inches set in August 2007 at Hokah in Houston County. [see: June 2024 Precipitation Total Map | June 2024 Precipitation Departure Map | June 2024 Climate Summary Table | June 2024 Percent of Normal Precipitation Map]
- Slow-moving thunderstorms with torrential downpours led to some of the highest rainfall totals on record in northeastern Minnesota on Tuesday June 18, 2024, closing roads and flooding towns from the Iron Range to the north shore of Lake Superior. A wide area from Walker to Grand Rapids, northeastward to the Canadian border and eastward to the shore of Lake Superior, received at least three inches of rain, with many areas seeing 4-6 inches and several locations reporting 6 to almost 8 inches of rain. The extreme rainfall inundated Iron Range communities from Hibbing through Hoyt Lakes and eastward towards Silver Bay and Lutsen, as well as those around Lake Vermilion. Cook was especially hard hit with several feet of water in the Comet Theater. Many roads in and out of town were impassible because of deep standing or flowing water. Segments of US Highways 53 and 169 had to be closed, as did parts of Minnesota Highways 1 and 61. Major flooding contributed to dangerous conditions and closures of facilities at Gooseberry Falls, Lake Vermilion-Soudan Underground Mine, and Tettegouche State Parks. The heaviest rainfall totals included 7.60 inches to the northwest of Tower, 7.33 inches about 20 miles north of Two Harbors, and 7.30 inches near Marble in Itasca County.
[see: Extreme Rainfall Drenches Northeastern Minnesota] - The extremely wet pattern that led to major flooding in northeast Minnesota on June 18th took one day off and then set its sights on southern Minnesota, where it dropped 6-9 inches of rain in three days in some areas, with widespread totals of over two inches. The rains caused significant flooding on local streams and parts of the Minnesota River. The three-day rainfall totals included 9.16 inches at the National Weather Service cooperative observing site in Windom, 8.86 inches at St. James, and 7-8 inches from CoCoRaHS observers in the Mankato area. The Rochester airport received 4.56 inches, the Twin Cities airport received 1.49 inches, and St. Cloud received just 0.27 inches. Duluth and International Falls received even less rain, and fortunately, the area hit hard on June 18th was largely spared during this event.
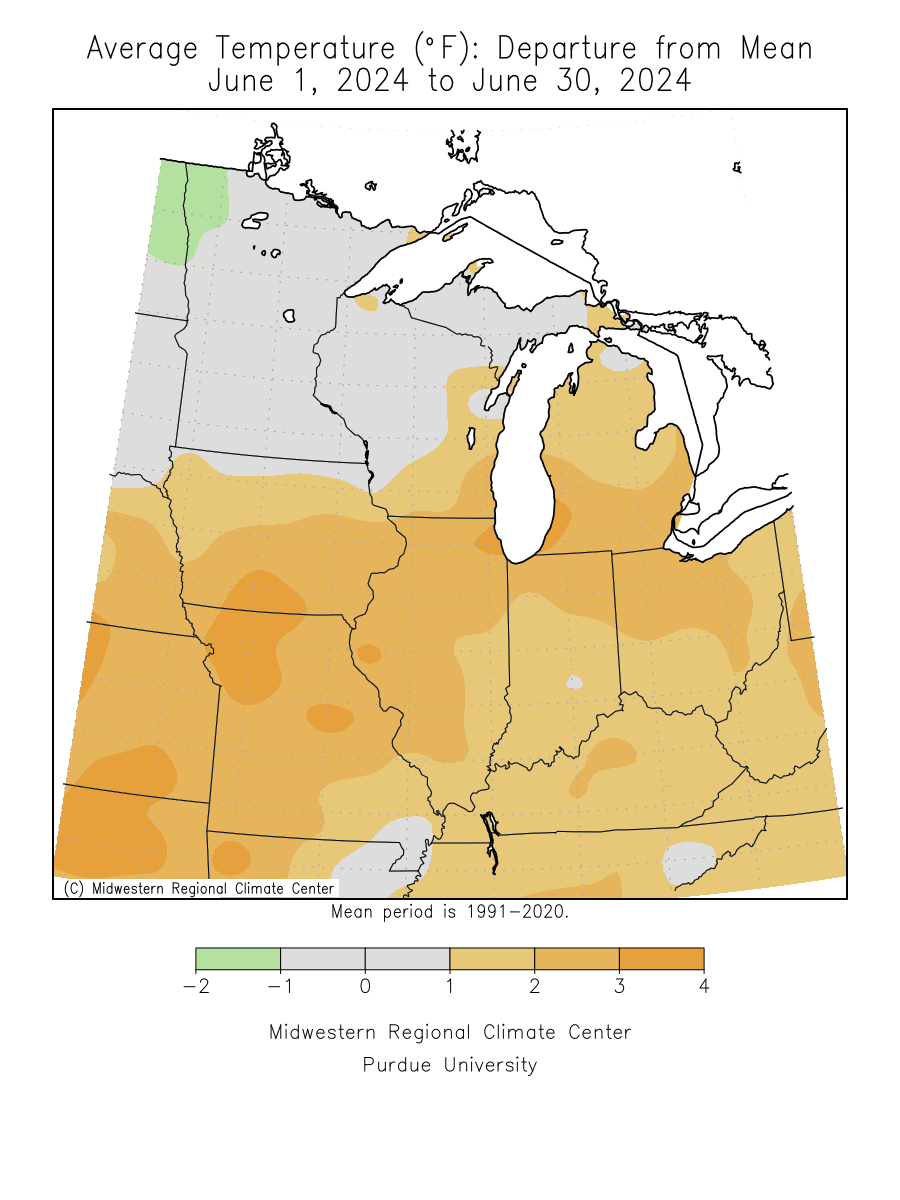
[see: Extreme Rain and Flooding in Southern Minnesota, June 20-22] - For the first time since July 2023, the monthly average temperature finished below normal, and broke the streak of warm Junes. June 2023 was the 4th warmest on record. The preliminary June 2024 average temperature was 65.4 degrees, or .2 degrees below normal. The warmest temperature reported in Minnesota for June 2024 was 94 degrees at Georgetown, Sabin and Granite Falls in western Minnesota on June 12-13 and the coldest temperature was at Brimson and Celina in northeast Minnesota on June 10.
[see: June 2024 Climate Summary Table | 2024 June Departure from Normal Temperature Map]
Where we stand now:
- Seasonal precipitation so far (April 1 through July 2) shows an extremely wet pattern in the state. The April-June precipitation total were in the top five wettest for many places in northeast and southern Minnesota and near the record wettest in spots as well with a large area of southern Minnesota in the 99th percentile ranking, near the record wettest. .
[see: Seasonal Precipitation Maps] - The U. S. Drought Monitor map released on July 2 depicts the entire state free of any drought designation. The U.S. Drought Monitor index is a blend of science and subjectivity where drought categories (Moderate, Severe, etc.) are based on several indicators.
[see: Drought Conditions Overview] - The U.S. Geological Survey reports that stream discharge levels are much above normal or high in the south and north, with a corridor of near normal streamflows from Duluth to Fargo. In general, rivers are slowly receding from their high levels in June, but many stream flows are elevated compared to a normal summer streamflow. .
[see: Cooperative Stream Gauging | USGS Stream Flow Conditions] - Water levels on most Minnesota lakes vary depending on lake and location in the state. Mille Lacs was at 11.75 ft, a little over a tenth of a foot above the median. The level on Lake Minnetonka on July 5 was at 929.92 feet with 300 cfs flowing through Gray's Bay Dam. White Bear Lake was 922.84 feet, about a tenth of a foot higher than this time last year. The lake level of Lake of the Woods was above the median range for this time of year. Lake Superior was forecast to be 602.10 feet for July 5, six inches lower than a year ago and right at the median. Lake Superior is forecast to rise two inches by August 5, 2024.
[see: Mille Lacs Lake Water Level | Lake Minnetonka Water Level | White Bear Lake Water Level | Lake of the Woods Control Board Basin Data | Corps of Engineers Great Lakes Water Levels] - The Agricultural Statistics Service on July 8 reported that topsoil moisture across Minnesota is 0 percent Very Short, 1 percent Short, 48 percent Adequate, and 51 percent Surplus. Soil moisture levels at Lamberton on July 1 were near record amount of soil water available with 9.01 inches.
[see: Agricultural Statistics Service Crop Progress and Condition | U. of M. Southwest Research & Outreach Center (Lamberton) | 2011-2018 Lamberton Soil Moisture Graphs ] - The wet summer 2024 has eased the fire danger. The potential for wildfires is currently rated by DNR Forestry as Low across the entire state.
[see: Fire Danger Rating Map]
Future prospects:
- The July precipitation outlook has a tendency for above normal precipitation, especially in the northeast past of the state. July precipitation normals range from just under three inches in northwest Minnesota to about five inches in southeastern counties.
[see: Climate Prediction Center 30-day Outlook | July Precipitation Normal Map] - While the rest of the country appears to be on the path of a hot summer, it appears that Minnesota and Wisconsin may be an oasis of closer to normal temperatures. There are equal chances of below, normal and above normal temperatures for July in Minnesota. Normal July high temperatures are in the 80s in the south and the upper 70s in the north. Normal July low temperatures are in the 50s in the north, and in the 60s in the south.
[see: Climate Prediction Center 30-day Outlook ] - The 90-day precipitation outlook (July-September) for Minnesota has equal chances of below, normal and above normal precipitation, with a slight tendency for above normal temperatures. What does the winter of 2024-25 hold? La Niña will be back and tends to bring more wintry weather than El Niño. The preliminary outlook for this winter has equal chances for above normal and below normal temperatures and a tilt for above normal precipitation. Perhaps more snow? We will see! [see: Climate Prediction Center 90-day Outlook | Meteorlogical Winter 2024-25]
From the author:
- The final monthly numbers are still coming in as of early July, but it appears likely that June 2024 was the second-wettest June and the second-wettest of any month on record in Minnesota The state-average rainfall for the month, based on "gridded" data from over 1000 observers, was 7.94 inches. Another statewide average will be available from NOAA during the second week in July, and the two estimates tend to be close to each other, though slightly different. Assuming that is the case, then June 2024 was exceeded only by the phenomenally wet June of 2014 (which averaged 8.03 inches), and finished well ahead of July 1897 (7.32 to 7.36 inches), and June 1914 (7.28 to 7.32 inches). [see: June 2024 Wetter Than Almost All Other Months]
Upcoming dates of note:
- July 18: National Weather Service releases 30/90-day temperature and precipitation outlooks